
On previous posts (part 1, part 2) I made the case that survival analysis is essential for better churn prediction. My main argument was that churn is not a question of “who” but rather of “when”.
In this post I’ll demonstrate that even when we’re interested with the “who” question (0/1 churn indicator) it’s often preferable to use survival analysis rather than simple classification.
Specifically I’ll show that using survival analysis we can detect changes to churn rates much earlier than when using the classification approach.
Simulation study
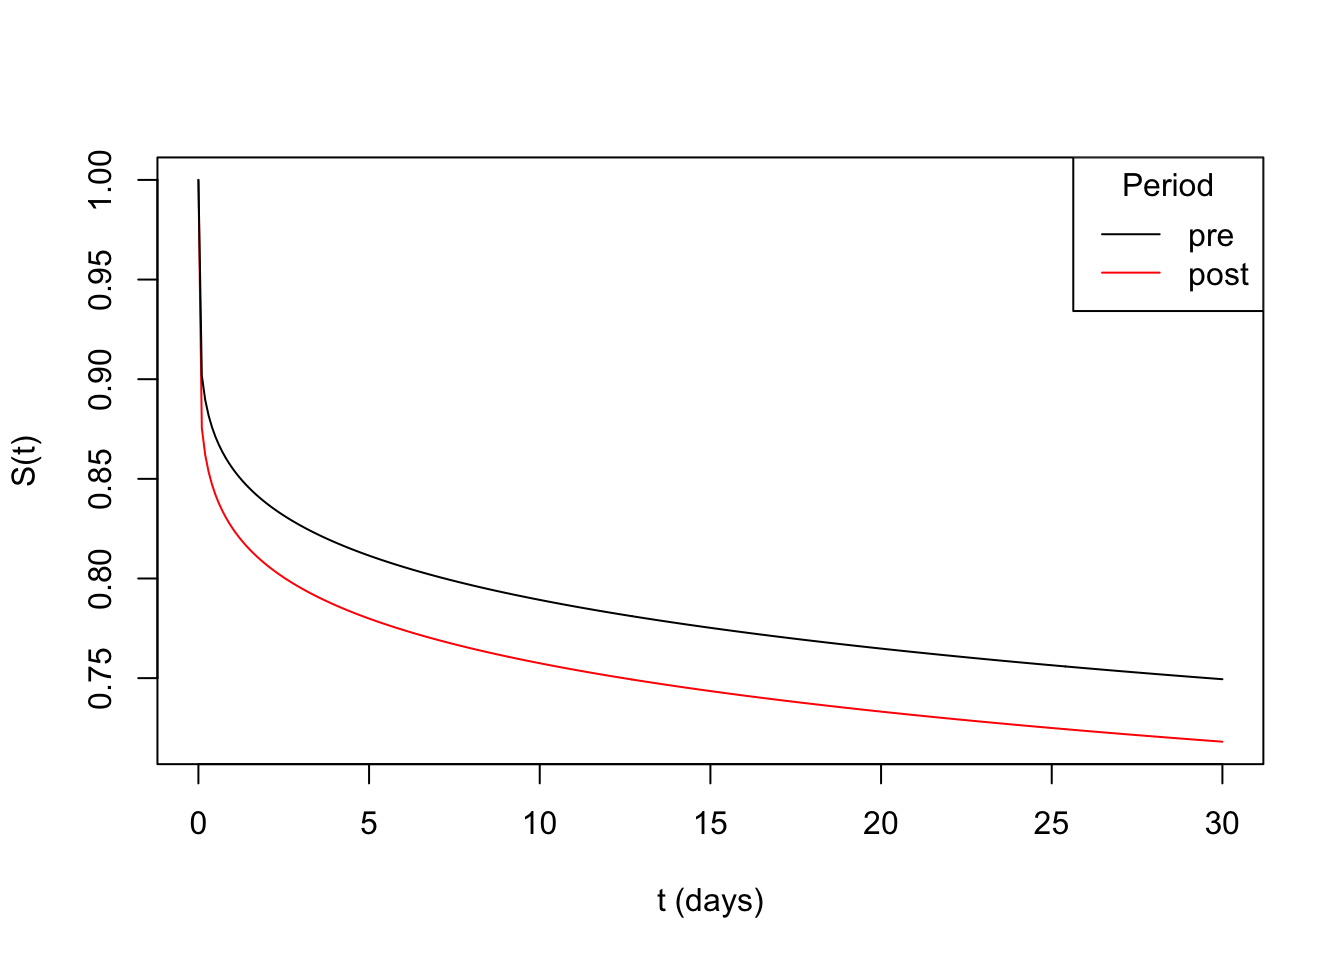
Going back to the classic cellphone subscribers example: imagine we’d like to monitor 30-day churn in new subscribers. For users who joined after May 1st 2023 we’ll simulate their subscription time before churning \(T\) using a Weibull distribution with shape parameter \(\alpha_{\text{pre}} =\) 0.18 and scale parameter \(\sigma = 30,000\). The 30 day churn rate in this case is 25.1% (\(P(T_{\alpha_{\text{pre}}} \leq 30)=\) 0.251).
After July 1st we’ll simulate users’ subscription time using a Weibull distribution with shape parameter \(\alpha_{\text{pre}}=\) 0.16 and scale parameter \(\sigma = 30,000\). The 30 day churn rate in this case is 28.2%.
Below we can see the survival curves for both periods:
Churn monitoring using classification
To measure 30 day churn using classification we’ll take a cohort of users who joined 30 to 37 days ago and label those with subscription time less than 30 days as churned and the rest as none churned.
Below we plot the churn rate over time, with the dashed purple line indicating the date after which the heightened churn rate users started joining:
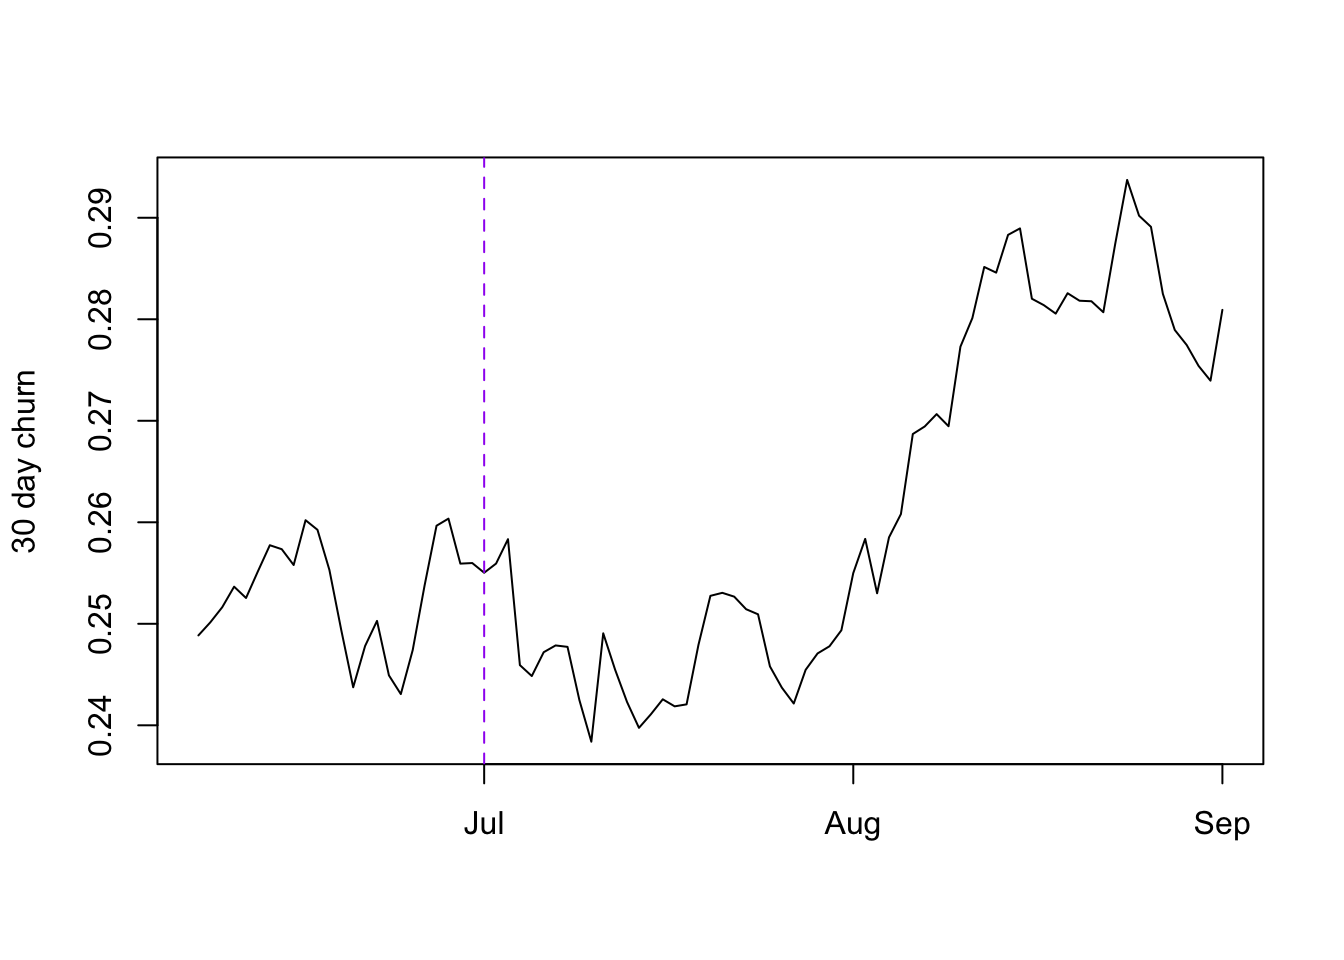
We can see that the 30 day churn rate started rising only a month after the heightened churn users started joining!
Churn monitoring done the right way - with survival analysis
When using survival analysis however we can use all users when constructing the survival curve. Let’s see how the survival estimate compares with the classification one:
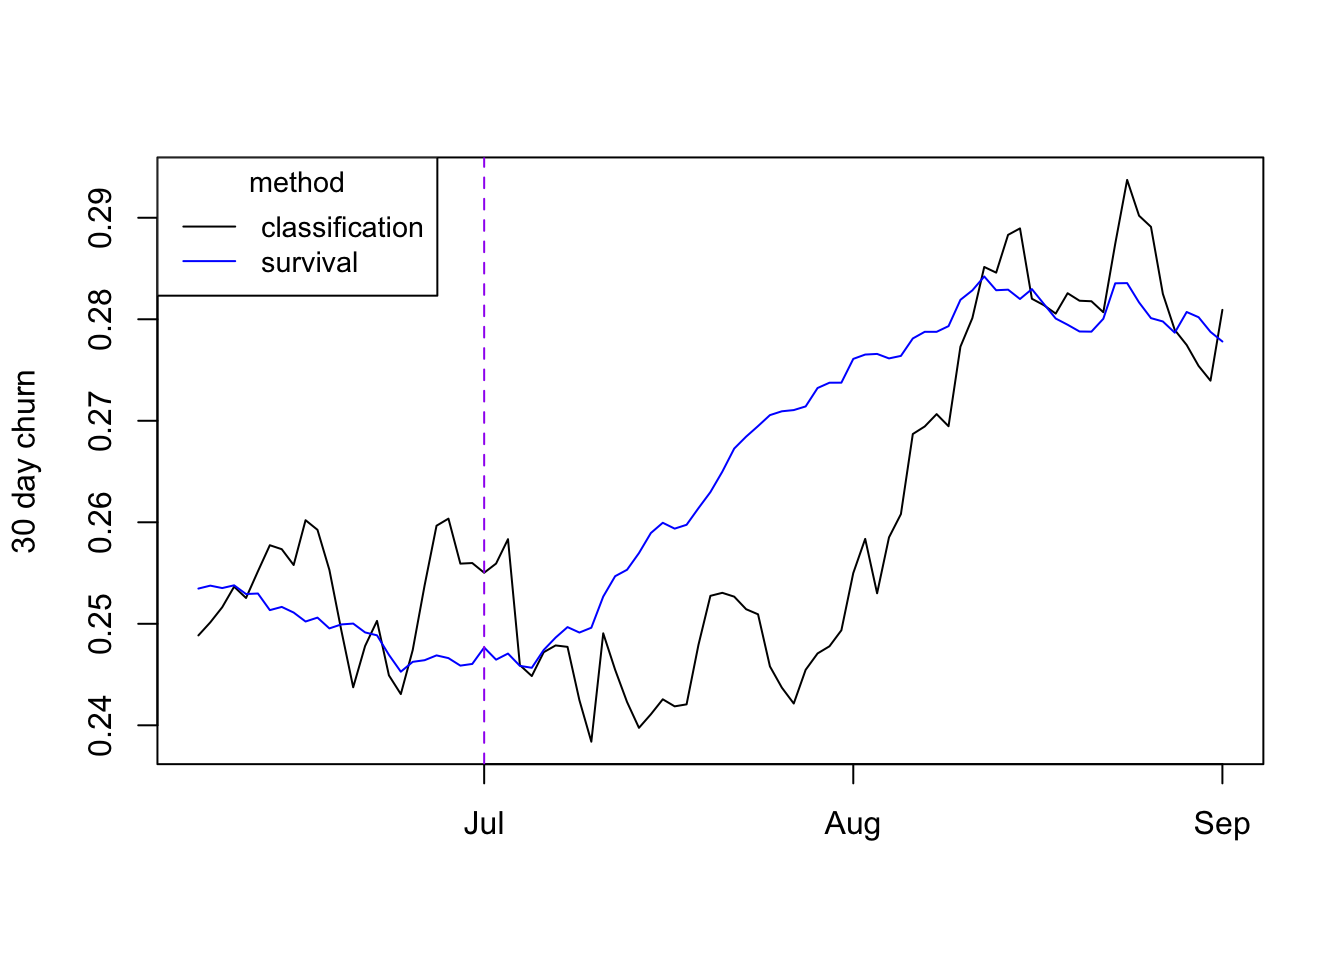 We can see that indeed the survival estimate upticks much earlier than the classification
one! We can also the estimate is more stable.
We can see that indeed the survival estimate upticks much earlier than the classification
one! We can also the estimate is more stable.
In summary
In this post we’ve seen yet another scenario where using survival analysis is preferable to using classification: Monitoring churn rates using survival can help us detect changes in churn much faster compared with classification.
If you’re interested with the simulation code used in this post go check it out on github